Electric Vehicle Powertrain Market Size and Share
Market Overview
| Study Period | 2020 - 2030 |
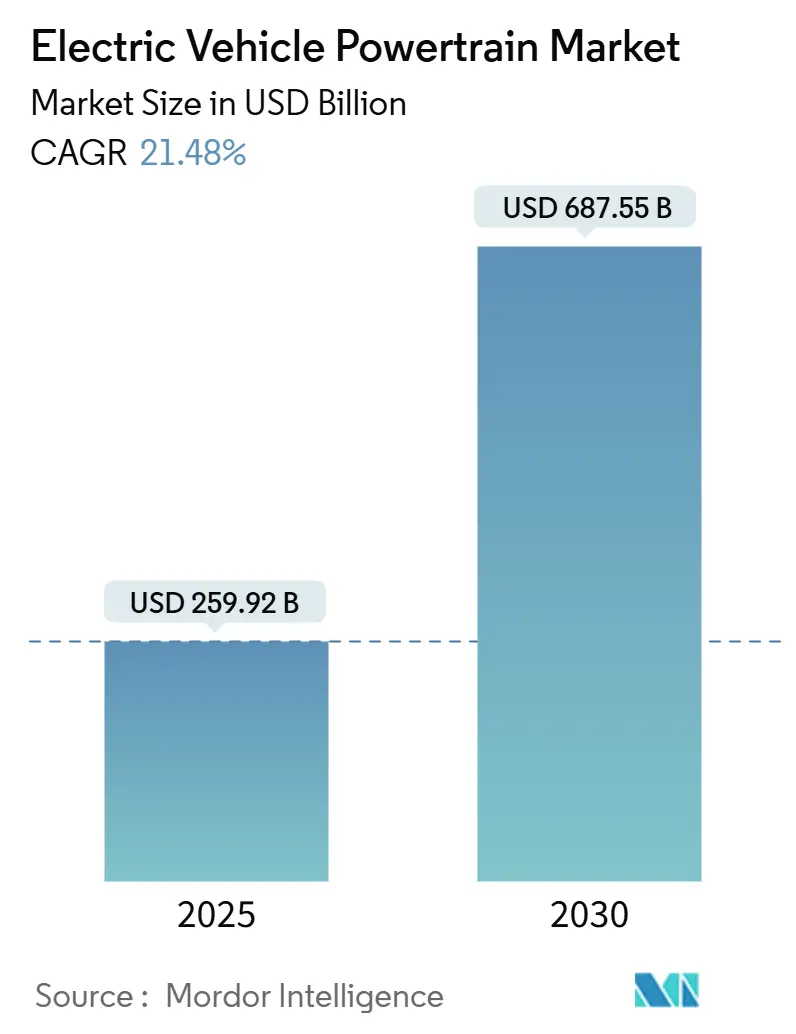
| Market Size (2025) | USD 259.92 Billion |
| Market Size (2030) | USD 687.55 Billion |
| Growth Rate (2025 - 2030) | 21.48% CAGR |
| Fastest Growing Market | Asia Pacific |
| Largest Market | Asia Pacific |
| Market Concentration | Medium |
Major Players
*Disclaimer: Major Players sorted in no particular order Image © Mordor Intelligence. Reuse requires attribution under CC BY 4.0. |
|
Electric Vehicle Powertrain Market Analysis by Mordor Intelligence
The electric vehicle powertrain market size stands at USD 259.92 billion in 2025 and is projected to reach USD 687.55 billion by 2030, translating into a 21.48% CAGR. Accelerated phase-outs of combustion engines, steady battery-pack price drops to USD 115 per kWh, and rapid adoption of 800-V architectures propel this expansion. Wide-bandgap semiconductors push inverter efficiency above 96%, while cell-to-pack engineering trims both weight and cost. Asia-Pacific leads the supply chain with integrated battery, motor, and electronics clusters, even as North America and Europe deploy powerful localization incentives.
Key Report Takeaways
- By component, battery packs held 38.32% revenue share in 2024, while power electronics is expanding at a 29.42% CAGR through 2030.
- By propulsion type, battery electric vehicles (BEVs) led with 71.24% of the electric vehicle powertrain market share in 2024 and are advancing at a 24.80% CAGR.
- By vehicle class, passenger cars accounted for 63.46% of the market size in 2024, whereas light commercial vehicles are set to grow at a 26.22% CAGR through 2030.
- By voltage architecture, ≤400 V systems commanded 88.11% of the market in 2024, yet 800 V platforms are growing at a 38.75% CAGR.
- By sales channel, OEM-fitted powertrains controlled 92.37% of 2024 revenue, while aftermarket retrofit kits are projected to climb at a 27.12% CAGR.
- By geography, Asia-Pacific captured 57.66% of revenue in 2024 and is set to post the fastest growth at a 26.64% CAGR through 2030.
Global Electric Vehicle Powertrain Market Trends and Insights
Drivers Impact Analysis
| Driver | (~) % Impact on CAGR Forecast | Geographic Relevance | Impact Timeline |
|---|---|---|---|
| EV Sales Surge Globally | +4.2% | Global (China, Europe lead) | Medium term (2–4 years) |
| Stricter Tailpipe & ZEV Mandates | +3.8% | North America, EU, spreading to APAC | Long term (≥4 years) |
| High-Nickel Battery Costs Falling | +3.1% | Global, China manufacturing base | Short term (≤2 years) |
| OEMs Adopt 800V Architectures | +2.9% | Premium segments worldwide | Medium term (2–4 years) |
| Incentives for Local e-Drive Manufacturing | +2.4% | North America, EU, India | Long term (≥4 years) |
| Tier-1s Integrate e-Axle Systems Vertically | +1.8% | Global auto-manufacturing hubs | Medium term (2–4 years) |
Source: Mordor Intelligence
Surging Global EV Sales Volumes
Electric-vehicle registrations crossed 17 million units in 2024, lifting plug-in share above 20% of world light-vehicle sales and boosting demand for motors, inverters and battery packs that are three times more semiconductor-intensive than comparable combustion drivetrains. China’s 11 million-unit tally alone reshaped volume planning for every supplier, while Europe’s incentives preserved double-digit growth despite macro headwinds. Each new EV requires around 80 kg of high-grade copper and significant rare-earth content, so component makers have ramped long-term supply contracts in tandem with capacity additions. Battery demand topped 1 TWh in 2024; with almost half now lithium iron phosphate, OEMs are redesigning pack formats to exploit the chemistry’s cost edge. Volume scale pushes total system costs down, yet intensifies supplier competition for long-run contracts that lock in price visibility through 2030.
Stringent Tail-Pipe & ZEV Regulations
The European Union will prohibit sales of new combustion cars by 2035, and California’s Advanced Clean Cars II rule enforces the same deadline in the United States [1]“Advanced Clean Cars II Regulations,” California Air Resources Board, arb.ca.gov. Similar zero-emission mandates cascade across Canada, South Korea and several Latin American markets, stripping automakers of any remaining latitude to delay electrification. Compliance costs for legacy internal-combustion platforms are now higher than the incremental spend required to launch a modern e-powertrain, redirecting R&D budgets toward integrated e-axle solutions and next-generation inverters. Suppliers already proficient in clean-sheet electric designs therefore gain bargaining power in platform sourcing rounds, because OEMs must compress traditional five-year cycles into three-year refreshes to stay ahead of regulation.
Rapid Cost Decline in High-Nickel Battery Chemistries
Benchmark pack prices dropped 20% year on year to USD 115 per kWh in 2024, with high-nickel NCM 811 and NCM 9½½ cells achieving 300 Wh/kg at the module level. The energy-density lift trims pack mass by up to 10%, freeing space for more sophisticated thermal and structural integration. Analysts expect cost to slide to USD 75 per kWh by 2030, allowing automakers to reach sticker-price parity with comparable gasoline models before the decade ends. The shift narrows the cost delta for 800-V components such as silicon-carbide MOSFETs, enabling their use in mid-price vehicles without undermining margin targets.
OEM Shift to 800-Volt Architectures
Porsche, Hyundai, General Motors and Mercedes have pledged broad 800-V rollouts by 2027, cutting 10–80% charge times below 20 minutes while downsizing cable gauges and thermal loads. New validation centers in Germany, China and the United Kingdom test motors, inverters and contactors up to 1,000 V, signaling that premium vehicle features will eventually trickle down to high-volume segments. Although SiC devices raise inverter cost by 25–30%, simulations show system efficiency gains recoup the premium within three years of average driving.
Restraints Impact Analysis
| Restraint | (~) % Impact on CAGR Forecast | Geographic Relevance | Impact Timeline |
|---|---|---|---|
| DC Fast-Charging Gaps in Emerging Markets | −2.8% | Emerging Asia, Africa, and Latin America | Medium term (2–4 years) |
| Volatile Supply of Critical Minerals | −2.1% | Global, China dependencies | Short term (≤2 years) |
| Thermal Runaway & Warranty Risk | −1.6% | Global, premium segments | Long term (≥4 years) |
| Skilled Talent Shortage for High-Voltage Manufacturing | −1.3% | North America, Europe | Medium term (2–4 years) |
Source: Mordor Intelligence
Public DC-Fast-Charging Gap in Emerging Markets
Twenty-two developing nations together host barely 14,100 public chargers, a level that deters fleet electrification and weakens consumer confidence [2]“Global Charging Infrastructure Update 2024,” International Council on Clean Transportation, theicct.org. Powertrains tuned for 400-V networks offer sufficient range but miss the full efficiency upside of 800-V hardware that requires higher-powered chargers. The investment deficit stems from fragile utility grids and limited private-sector financing. Vehicle makers must therefore tailor drivetrain configurations to local infrastructure realities, often opting for larger battery packs or onboard generators, which inflate curb weight and blunt energy efficiency gains.
Critical-Mineral Supply Volatility
Lithium carbonate spot prices collapsed 80% between early-2023 and late-2024 even as demand rose 30%, exposing the sector to wrenching swings that complicate budget planning. China processes 60–70% of global lithium, cobalt and manganese, magnifying geopolitical risk and spurring the United States, the European Union and Japan to launch strategic-reserve and recycling programs. OEMs are hedging by adopting lithium iron phosphate and emerging sodium-ion chemistries that rely on more abundant materials, yet these alternatives reshape thermal-management needs and inverter control algorithms.
Segment Analysis
By Component: Battery Packs Drive Value While Power Electronics Accelerate
Battery packs contributed 38.32% revenue in 2024, making them the single largest element of the electric vehicle powertrain market, yet the power-electronics block is growing faster at 29.42% CAGR as wide-bandgap devices unlock higher switching speeds. Average pack capacity rose to 62 kWh in 2024 for passenger cars, a level that pushes demand for improved thermal paths and integrated structural designs. Silicon-carbide inverters now reach 97% peak efficiency, slicing highway power losses by double digits and extending vehicle range without adding battery mass. Drive-unit suppliers layer permanent-magnet motors with hairpin windings and compact reduction gears, allowing finer torque control while shaving drivetrain noise. Higher-value content per vehicle spurs a wave of mergers among inverter, motor, and gearbox suppliers that pursue e-axle bundles promising double-digit margins. Concurrently, thermal-management specialists introduce multi-channel cold-plate assemblies that cool battery modules and power electronics from a single loop, saving 15% system weight.
Integrated DC-DC converters share common cooling plates with on-board chargers, shrinking under-hood space requirements in compact crossover models. Motor suppliers increase permanent-magnet free designs that use copper-rotor induction or switched-reluctance topologies to reduce dependence on dysprosium and neodymium. Tier-1 giants announce multi-year supply accords with domestic and Chinese chip fabricators to secure next-generation 1,200-V SiC dies for 2028 vehicle launches. As suppliers vertically integrate, intellectual-property battles intensify around gate-drive algorithms and heat-spreader layouts that deliver the last two points of efficiency.

Note: Segment shares of all individual segments available upon report purchase
By Propulsion Type: BEV Dominance Accelerates Market Transformation
Battery electric vehicles captured 71.24% of share in 2024 and are forecast to clip along at 24.80% CAGR, confirming the market’s pivot away from plug-in hybrids and range-extended architectures. Dedicated BEV skateboard platforms shave 30 kg of wiring and simplify assembly by integrating the battery pack as a stressed chassis member. Regulatory credit regimes in China, the European Union, and twelve U.S. states give carmakers an effective price advantage of USD 3,000–USD 5,000 per BEV compared with hybrid equivalents, widening BEV adoption. Fast-charger build-outs across Germany, France, and Norway raise public confidence, enabling compact-segment BEVs with smaller packs, which in turn shift component demand toward higher power-density inverters. Automakers employ cell-to-pack and cell-to-chassis strategies to strip module casings and increase volumetric energy density by up to 20%, indirectly boosting thermal-management spending.
Fuel-cell electric vehicles remain below 1% of unit volume yet draw significant R&D within heavy-duty logistics corridors in California, Japan, and South Korea, where hydrogen fueling networks cluster. Over the forecast horizon, BEVs siphon share from mild-hybrid and conventional powertrains in urban buses, municipal fleets and ride-hail operators that optimize around lower total cost of ownership. Component suppliers respond with scalable inverter families that toggle between 400 V and 800 V to serve both BEV and PHEV platforms without redesign, while software-defined powertrain controllers handle dual traction sources for transitional architectures.
By Vehicle Class: Passenger Cars Lead While Light Commercial Vehicles Accelerate
Passenger cars remained the largest slice of the electric vehicle powertrain market size at 63.46% in 2024, reflecting entrenched consumer demand and deep model portfolios across all major OEMs. Light commercial vehicles, however, post the fastest expansion and are forecast to surge at 26.22% CAGR through 2030. Municipal incentives and predictable duty cycles push fleets toward battery-electric vans that trim operating costs despite higher ticket prices. The passenger-car segment sustains volume supremacy by leveraging skateboard architectures that simplify assembly and accommodate a widening array of body styles. Meanwhile, commercial-van makers focus on payload-friendly pack designs and liquid-immersion cooling to safeguard battery health during intensive daily routes. Over the forecast horizon, passenger cars will continue to anchor absolute revenue, yet light commercial vehicles will capture outsized incremental growth, prompting suppliers to diversify motor-inverter portfolios that span both duty profiles.
The dual-track dynamic shapes component road maps. Passenger-car OEMs integrate cell-to-pack construction to reduce mass, while fleet operators trial lithium-titanate chemistries that tolerate rapid charge–discharge cycles. Suppliers develop scalable e-axle families that fit sedans, crossovers and short-wheelbase vans, compressing design time and spreading R&D costs. As charging networks densify, commercial-vehicle buyers increasingly accept smaller packs paired with 150 kW depot chargers, reinforcing the 22.5% CAGR outlook for this class. Passenger-car growth, though slower, still outpaces internal-combustion replacements, ensuring that drivetrain orders tied to this 65.5% share remain a dependable revenue engine across the ecosystem.
By Voltage Architecture: ≤400 V Dominates, 800 V Surges
≤400 V systems controlled 88.11% of the electric vehicle powertrain market share in 2024, anchoring mass-market affordability and supplying volume scale for entry-level models. In stark contrast, 800 V platforms exhibit the fastest trajectory, racing ahead at a 38.75% CAGR to 2030 as premium brands chase sub-20-minute charge times and improved efficiency. The entrenched 400 V foothold benefits from mature component ecosystems and lower silicon costs, enabling automakers to price vehicles competitively in cost-sensitive segments. Yet the 800 V wave, initially confined to luxury performance cars, is already filtering into midsize crossovers where buyers value quick top-ups on highway trips.
Technology spillover accelerates the transition: 1,200 V silicon-carbide devices now clear automotive qualification, opening margin headroom for mainstream nameplates. Cable makers leverage higher voltage to reduce conductor diameter, trimming wiring mass by up to 40%. Charging-station builders respond with 350 kW dispensers that future-proof networks for next-generation packs. While ≤400 V architectures will remain the revenue bedrock through 2030, the 30.5% CAGR enjoyed by 800 V systems compels every Tier-1 supplier to field dual-voltage inverters and e-axle modules. OEMs hedging between architectures deploy modular battery enclosures that accommodate both 400 V and 800 V strings, guarding against forecast error as consumer expectations evolve.

Note: Segment shares of all individual segments available upon report purchase
By Sales Channel: Aftermarket Retrofit Gains Momentum
OEM-installed systems ruled with 92.37% share in 2024, but the retrofit channel is surging at 27.12% CAGR through 2030 as school-bus fleets, refuse trucks, and municipal vans seek electrification without purchasing brand-new chassis. Converters in California, the Netherlands, and South Korea market drop-in e-axles and modular battery sleds that bolt to existing mounting points, converting diesel sprinters to emission-free runabouts within 48 hours. Regulatory clarity arrives as Germany, France, and the United States publish retrofit homologation handbooks that verify crashworthiness and battery integrity, making financing easier.
Warranty risk remains a headwind, prompting suppliers to bundle predictive-maintenance software and onboard telematics that report state-of-health data at one-minute intervals. Battery second-life firms offer lease plans in which end-of-life packs become stationary storage, compressing fleet payback periods. Rural transport cooperatives retrofit minivans with sodium-ion packs tolerant of ambient-temperature swings and free of nickel or cobalt, lowering cost while avoiding supply-chain volatility.
Geography Analysis
Asia-Pacific commanded 57.66% of the electric vehicle powertrain market in 2024 and is projected to grow at 26.64% CAGR through 2030 as China exports value-priced electric crossovers to Latin America and Eastern Europe. Chinese battery champions held 37.9% global share, giving the region scale advantages that drive pack prices toward USD 90 per kWh. India’s Production-Linked Incentive program disburses subsidies equal to up to 15% of domestic value added, spurring local assembly of motors, controllers and lithium iron phosphate cells. Japan leverages power-device know-how to ship SiC MOSFETs worldwide, while South Korea supplies high-nickel NCM cathodes to European gigafactories.
North America trails in volume but benefits from USD 250 billion of announced investment across batteries, motors and inverter fabs since mid-2022. The Inflation Reduction Act’s clean-vehicle credit requires 60% North-American battery-component value in 2025, prompting Korean and Japanese suppliers to build cathode-active-material plants in Kentucky, Tennessee and Quebec. Mexico rises as a low-cost e-motor hub exporting to both U.S. and European plants. Canada’s mineral wealth underpins cathode refining ventures that aim to supply half of the continent’s lithium needs by 2030.
Europe wrestles with uneven momentum: Germany and France sustain double-digit BEV penetration, yet the United Kingdom saw a 20% retreat in electric-vehicle output during 2024 due to stalled incentives and battery-capacity shortfalls. The European Union’s Fit-for-55 package and CO₂ fleet mandates keep long-term demand intact, driving suppliers such as ZF to open an 800 V testing lab near Birmingham in October 2024[3]“ZF Opens 800-Volt Test Lab in UK,” ZF Friedrichshafen AG, press.zf.com . Eastern European countries pitch competitive labor costs to attract final-assembly plants, filling the gap left by ICE component contraction. Meanwhile, Middle East and Africa remain nascent but post 40% annual growth from a small base, aided by Gulf sovereign-wealth funds that bankroll battery-cell manufacturing in Saudi Arabia and the United Arab Emirates.

Competitive Landscape
Competitive Landscape
The electric vehicle powertrain market exhibits moderate consolidation with intensifying competition as traditional automotive suppliers vie against technology companies and battery specialists for position. Established Tier-1 suppliers such as Bosch, Magna and ZF leverage their manufacturing scale and OEM relationships to secure integrated powertrain contracts, while emerging players including Tesla and BYD disrupt traditional supply chains through vertical integration strategies that bypass conventional supplier networks. Competitive dynamics now reward companies holding deep capabilities across power electronics, thermal management and system-level integration because automakers increasingly prefer single-source solutions that reduce complexity and improve performance optimization.
Strategic patterns reveal three dominant approaches: vertical integration by automakers seeking control over critical technologies, horizontal expansion by suppliers acquiring complementary capabilities and specialization by technology players focusing on high-value components such as wide-bandgap semiconductors. Patent activity in silicon-carbide and gallium-nitride device packaging highlights intellectual property as a rising differentiator. White-space opportunities appear in thermal-management systems for 800 V architectures and wireless-charging modules, while disruptors deploy artificial-intelligence-driven design tools to accelerate development cycles.
Mahle, Valeo and Hanon Systems highlight thermal-system innovation, introducing integrated chiller plates that cool both battery and inverter loops from a single pump. BorgWarner acquired Santroll’s e-motor business to augment hairpin-wound stator production, and Dana snapped up inverter start-ups to complete its e-axle portfolio. Meanwhile, Wolfspeed, STMicroelectronics and Rohm expand 1,200 V SiC capacity in the United States, Europe and Japan, ensuring chip availability for 2028 vehicle launches.
Electric Vehicle Powertrain Industry Leaders
-
Tesla, Inc.
-
Magna International Inc.
-
BorgWarner Inc.
-
Bosch Mobility (Robert Bosch GmbH)
-
BYD Co. Ltd.
- *Disclaimer: Major Players sorted in no particular order

Recent Industry Developments
- June 2025: ZF launched its SELECT e-drive platform for passenger-car applications, promising 96% peak drivetrain efficiency and modular 400 V/800 V compatibility.
- March 2025: SK On secured a contract to supply Nissan with 100 GWh of batteries from 2028 to 2033, locking in volumes for the automaker’s next-generation crossover lineup.
- October 2024: ZF opened the United Kingdom’s first dedicated 800 V test and validation laboratory at its Solihull R&D hub to accelerate component qualification.
- July 2024: QuantumScape partnered with PowerCo, Volkswagen’s battery subsidiary, to industrialize solid-state lithium-metal cells aimed at commercial launch by 2028.
Global Electric Vehicle Powertrain Market Report Scope
A powertrain is a set of components that generate power to move the vehicle. The electric powertrain encompasses the battery and electric motor. It offers transmission of power, which is used to produce the power that is further utilized to drive or move the vehicle. The electric powertrain of a vehicle is defined by its performance, comfort, and safety.
The EV powertrain market is divided into segments based on component type, including transmission, motors, and battery. Furthermore, it's categorized by propulsion type, distinguishing between battery electric vehicles and plug-in hybrid electric vehicles. Additionally, the market is segmented by vehicle type, covering passenger cars and commercial vehicles. Lastly, the geographical aspect includes North America, Europe, Asia-Pacific, and the Rest of the World.
The report offers market size and forecasts for the electric vehicle powertrain market in terms of value (USD) for all the above segments.
| By Component | Electric Motors | Permanent-Magnet Synchronous | |
| Induction | |||
| Switched-Reluctance | |||
| Transmission / e-Axle Systems | Single-Speed | ||
| Multi-Speed | |||
| Power Electronics | Inverters | ||
| DC-DC Converters | |||
| On-Board Chargers | |||
| Battery Pack | |||
| Thermal Management Systems | |||
| High-Voltage Cabling & Controllers | |||
| By Propulsion Type | Battery Electric Vehicle (BEV) | ||
| Plug-in Hybrid Electric Vehicle (PHEV) | |||
| Fuel-Cell Electric Vehicle (FCEV) | |||
| By Vehicle Class | Passenger Cars | ||
| Light Commercial Vehicles | |||
| Heavy Commercial Vehicles | |||
| Two and Three-Wheelers | |||
| Off-Highway Vehicles | |||
| By Voltage Architecture | Less than equal to 400 V Systems | ||
| 800 V Systems | |||
| Above 800 V Systems | |||
| By Sales Channel | OEM-Fitted Powertrains | ||
| Aftermarket Retrofit Kits | |||
| By Geography | North America | United States | |
| Canada | |||
| Rest of North America | |||
| South America | Brazil | ||
| Argentina | |||
| Rest of South America | |||
| Europe | Germany | ||
| United Kingdom | |||
| France | |||
| Italy | |||
| Spain | |||
| Netherlands | |||
| Rest of Europe | |||
| Asia-Pacific | China | ||
| Japan | |||
| India | |||
| South Korea | |||
| Thailand | |||
| Vietnam | |||
| Rest of Asia-Pacific | |||
| Middle East and Africa | Saudi Arabia | ||
| United Arab Emirates | |||
| Turkey | |||
| South Africa | |||
| Egypt | |||
| Rest of Middle East and Africa | |||
| Electric Motors | Permanent-Magnet Synchronous |
| Induction | |
| Switched-Reluctance | |
| Transmission / e-Axle Systems | Single-Speed |
| Multi-Speed | |
| Power Electronics | Inverters |
| DC-DC Converters | |
| On-Board Chargers | |
| Battery Pack | |
| Thermal Management Systems | |
| High-Voltage Cabling & Controllers |
| Battery Electric Vehicle (BEV) |
| Plug-in Hybrid Electric Vehicle (PHEV) |
| Fuel-Cell Electric Vehicle (FCEV) |
| Passenger Cars |
| Light Commercial Vehicles |
| Heavy Commercial Vehicles |
| Two and Three-Wheelers |
| Off-Highway Vehicles |
| Less than equal to 400 V Systems |
| 800 V Systems |
| Above 800 V Systems |
| OEM-Fitted Powertrains |
| Aftermarket Retrofit Kits |
| North America | United States |
| Canada | |
| Rest of North America | |
| South America | Brazil |
| Argentina | |
| Rest of South America | |
| Europe | Germany |
| United Kingdom | |
| France | |
| Italy | |
| Spain | |
| Netherlands | |
| Rest of Europe | |
| Asia-Pacific | China |
| Japan | |
| India | |
| South Korea | |
| Thailand | |
| Vietnam | |
| Rest of Asia-Pacific | |
| Middle East and Africa | Saudi Arabia |
| United Arab Emirates | |
| Turkey | |
| South Africa | |
| Egypt | |
| Rest of Middle East and Africa |
Key Questions Answered in the Report
What is the current electric vehicle powertrain market size and how fast is it expanding?
The electric vehicle powertrain market size is USD 259.92 billion in 2025 and is forecast to reach USD 687.55 billion by 2030, registering a 21.48% CAGR.
Which component captures the largest share and which one is growing the fastest?
Battery packs command 38.32% of 2024 revenue, while power electronics is the fastest-growing component at a 29.42% CAGR through 2030.
Which propulsion type dominates the market and what is its growth trajectory?
Battery electric vehicles hold 71.24% of 2024 demand and are advancing at a 24.80% CAGR to 2030.
Which region leads in revenue and what is its projected growth rate?
Asia-Pacific owns 57.66% of 2024 revenue and is set to expand at a 26.64% CAGR, the fastest worldwide.

