Market Overview
| Study Period | 2020 - 2030 |
| Market Size (2025) | USD 42.68 Billion |
| Market Size (2030) | USD 72.63 Billion |
| Growth Rate (2025 - 2030) | 11.22% CAGR |
| Fastest Growing Market | Asia Pacific |
| Largest Market | Asia Pacific |
| Market Concentration | Medium |
Major Players
*Disclaimer: Major Players sorted in no particular order Image © Mordor Intelligence. Reuse requires attribution under CC BY 4.0. |
|

Global Waste To Energy (WTE) Market Analysis by Mordor Intelligence
The Global Waste To Energy Market size is estimated at USD 42.68 billion in 2025, and is expected to reach USD 72.63 billion by 2030, at a CAGR of 11.22% during the forecast period (2025-2030).
Growth rests on two converging pressures: swelling urban waste streams and the worldwide push for low-carbon power. Thermal technologies remain the backbone of capacity additions, yet investments are shifting toward advanced, lower-emission solutions such as plasma-arc and upgraded anaerobic digestion. Active carbon-price regimes in South Korea and the European Union are reshaping project economics, while landfill bans in India’s Tier-2 cities accelerate feedstock availability. Strategic consolidation among utilities, environmental services firms, and technology specialists continues, and digital optimization tools are lifting operating margins and compliance performance across new and retrofit plants. Together, these forces sustain a robust pipeline of bankable projects and position the waste to energy market as a pivotal element of the circular economy.
Key Report Takeaways
- By technology, incineration/combustion led with 65% of the waste to energy market share in 2024; plasma-arc is projected to expand at a 16% CAGR through 2030.
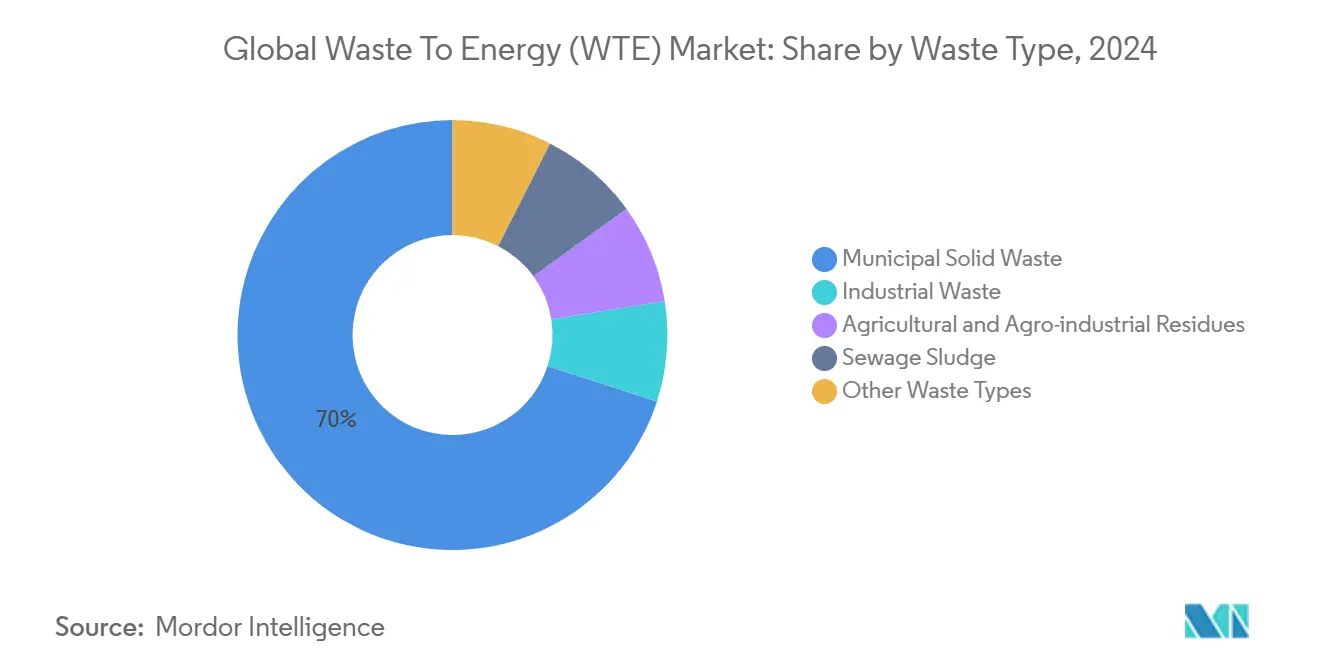
- By waste type, municipal solid waste accounted for 70% of the waste to energy market size in 2024, while agricultural and agro-industrial residues are forecast to grow at 14% CAGR to 2030.
- By energy output, electricity generation commanded 55% of the waste to energy market size in 2024; transportation fuels are advancing at 17% CAGR between 2025–2030.
- By end user, utilities & independent power producers held 60% of the waste to energy market share in 2024, whereas transport fuel distributors show the highest projected 17% CAGR through 2030.
- By geography, Asia-Pacific contributed 45% of 2024 revenue; the region is on track for the fastest 13% CAGR during the forecast horizon.
Global Waste To Energy (WTE) Market Trends and Insights
Drivers Impact Analysis
| Driver | (~) % Impact on CAGR Forecast | Geographic Relevance | Impact Timeline |
|---|---|---|---|
| Rapid roll-out of EfW PPP pipelines in China’s Greater Bay Area | 2.80% | Asia-Pacific (China) | Medium term (2-4 years) |
| EU Green Taxonomy incentives for retrofit of legacy fleets | 2.30% | Europe | Medium term (2-4 years) |
| National bans on unsegregated landfill in India’s Tier-2 cities | 1.50% | Asia-Pacific (India) | Short term (≤2 years) |
| Soaring carbon credit prices improving IRRs in South Korea | 1.20% | Asia-Pacific (South Korea) | Short term (≤2 years) |
Source: Mordor Intelligence
Rapid Roll-out of EfW Public-Private Partnership Pipelines in China’s Greater Bay Area
Investments topping CNY 35 billion are funding more than 80 projects that deploy advanced emissions monitoring and material-recovery designs. New plants form a high-capacity cluster processing over 400,000 tons daily, cementing the region’s template for scalable urban waste solutions[1]Cui Luo-cheng, “Energy-from-Waste in China’s Greater Bay Area,” National Bureau of Statistics of China, stats.gov.cn. Electricity output from clean sources, including WTE, rose 16.4% year-on-year in 2024, confirming policy momentum and investor confidence.
EU Green Taxonomy Incentives Accelerating Retrofit of Legacy Incineration Fleets
The Green Taxonomy links financing to strict energy-efficiency metrics, unlocking roughly EUR 300 million for retrofit work that couples upgraded flue-gas systems with expanded material reclamation[2]European Commission, “EU Taxonomy Delegated Acts for Climate Change Mitigation,” ec.europa.eu. Operators that comply gain lower funding costs and priority grid access, reinforcing the waste-to-energy market across Western and Northern Europe.
National Bans on Unsegregated Landfill Triggering MSW Diversion in India’s Tier-2 Cities
Under Swachh Bharat Mission 2.0, source-segregation rates climbed from 18% in 2014 to 70% in 2021, and landfill bans are propelling municipal tenders for mid-scale WTE projects. Integrating informal waste pickers into formal supply chains boosts feedstock quality and community income, creating a replicable model for emerging urban centers.
Soaring Carbon Credit Prices Improving WTE Project IRRs in South Korea
Carbon pricing lifted certified-credit values, enabling WTE developers to capture a second revenue stream beyond tipping fees and power sales. Rigorous methane-avoidance accounting has strengthened buyer confidence in credit integrity, drawing institutional investors into project equity.
Restraints Impact Analysis
| Restraint | (~) % Impact on CAGR Forecast | Geographic Relevance | Impact Timeline |
|---|---|---|---|
| Stricter dioxin emission caps delaying grate-furnace permits in Germany | -1.70% | Europe (Germany) | Medium term (2-4 years) |
| Limited tipping-fee escalation clauses reducing bankability in Indonesia | -1.30% | Asia-Pacific (Indonesia) | Short term (≤2 years) |
Source: Mordor Intelligence
Stricter Dioxin Emission Caps Postponing Permits for Grate-Furnace Refurbishments in Germany
The 2024 Industrial Emissions Directive tightens limits and mandates e-permits by 2035, forcing operators of older plants to redesign air-pollution-control systems[3]European Environmental Bureau, “Revision of Industrial Emissions Directive 2024,” eeb.org. Compliance costs and protracted approvals delay capacity upgrades and dampen the waste-to-energy market in Europe’s largest economy.
Limited Tipping-Fee Escalation Clauses Hurting Project Bankability in Indonesia
Fixed-fee frameworks under Presidential Regulation 35/2018 disregard inflation and forex risk, constraining debt service coverage and slowing financial close for priority city projects. Indonesia still needs USD 4 billion for collection and sortation infrastructure, highlighting an urgent policy gap.
Segment Analysis
By Technology: Plasma-Arc Disrupts Traditional Thermal Dominance
Incineration retained 65% of the waste to energy market share in 2024, anchored by proven operational history and integration with district-heat infrastructure across Europe and East Asia. Plants above 200,000 tpa continue to deploy grate-furnace designs due to predictable runtime and established supplier networks. Nevertheless, plasma-arc capacity is forecast to log a 16% CAGR to 2030, thanks to 99% waste-to-syngas conversion efficiency and sharply lower dioxin formation. Subsidy schemes that reward lower emissions and higher metals recovery further tilt project pipelines toward plasma-arc, especially in densely populated Asian conurbations. The waste to energy market size tied to advanced thermal platforms therefore accelerates faster than the headline rate.
Hybridization trends are reshaping asset specifications: several new builds bundle front-end mechanical biological treatment with either gasification or plasma-arc to boost recycling yields before thermal conversion. Meanwhile, anaerobic digestion enjoys renewed focus in agrarian regions where high-moisture organic waste offers superior biogas yields at modest capital cost. Mechanical, thermal, and chemical pretreatments now lift methane production by 25%–190%, widening the economic sweet spot for distributed digesters. Over the forecast period, digital twins and AI-assisted combustion controls are expected to enhance thermal-island efficiency by 4%–6% on a lifecycle basis, further differentiating next-generation facilities.
By Waste Type: Agricultural Residues Challenge MSW Dominance
Municipal solid waste accounted for 70% of the waste to energy market size in 2024, buoyed by steady collection volumes and regulatory pressure to move away from landfilling. High calorific industrial fractions and source-segregation programs in major cities sustain robust feedstock quality, supporting baseload energy output. Agricultural and agro-industrial residues, however, will post a 14% CAGR through 2030 as governments target methane mitigation in rural supply chains. Financial incentives for farmers to supply crop stover and manure unlock previously untapped energy potential and align with soil-health goals via digestate use.
Industrial waste streams featuring plastics, solvents, and high-Btu sludges present stable demand for specialized rotary-kiln and fluidized-bed systems. Sewage sludge gains visibility where stricter discharge norms require additional treatment: thermal drying coupled with mono-incineration now yields phosphorus-rich ash that can be recycled into fertilizer. Across categories, pre-processing and optical sorting technologies are raising net calorific value and reducing contaminants, a trend that supports higher plant availability and longer maintenance cycles within the waste to energy market.
Note: Segment share of all individual segment available on report purchase
By Energy Output: Transportation Fuels Drive Diversification
Electricity generation remained the largest sub-segment with 55% revenue share in 2024. Feed-in tariffs and guaranteed-dispatch regimes in China, Japan, and parts of Europe underpin steady cash flows that suit infrastructure-fund mandates. Yet transportation fuels will achieve a 17% CAGR over 2025–2030 as bio-SNG, bio-LNG, and ethanol gain traction in logistics and public-transit fleets. Life-cycle analysis confirms that biogas-derived fuels cut CO2 emissions by 84% relative to diesel, sharpening their competitive edge under tightening fleet decarbonization rules.
Heat production continues to anchor plant economics in Scandinavia and Central Europe where district systems already serve more than 50 million citizens. Combined heat and power configurations reach efficiency above 80%, and flexible dispatch complements variable wind and solar inputs. Looking forward, integrated WTE-with-hydrogen hubs are under evaluation: high-temperature steam and renewable electricity co-located on-site can power electrolysis units, enabling multi-vector energy output that deepens the waste to energy market footprint.
By End-User: Transport Fuel Distributors Gain Momentum
Utilities and IPPs commanded 60% of 2024 revenue, leveraging economies of scale and established grid links. Portfolio diversification among these players now extends into advanced recycling and carbon capture, signaling a broader resource-management strategy. Transport fuel distributors segment will expand fastest at 17% CAGR, propelled by low carbon fuel standards in California, British Columbia, and the European Union. Dedicated offtake contracts support investment in upgrading plants that produce renewable CNG for buses and refuse trucks.
Industrial captive users favor on-site facilities that convert production scrap and wastewater into process steam, trimming disposal fees and improving energy security. District heating operators in Denmark and Sweden rely on WTE for roughly 42.6% of network supply, and new tenders in Poland and the Baltics suggest further regional growth. Across customer groups, circularity commitments push stakeholders to prioritize facilities able to extract recyclables and generate certified carbon credits, reinforcing the strategic relevance of the waste to energy market.

Note: Segment share of all individual segment available on report purchase
Geography Analysis
Asia-Pacific posted 45% of 2024 revenue and will hold the pole position with a 13% regional CAGR to 2030. China alone operates over 400 plants processing 400,000 tons daily, with the capacity to climb to 700,000 tons per day by 2025(4)Cui Luo-cheng, “Energy-from-Waste in China’s Greater Bay Area,” National Bureau of Statistics of China, stats.gov.cn. India’s Tier-2 cities, guided by Swachh Bharat Mission 2.0, are issuing build-operate-transfer contracts that favor modular lines sized at 300–500 tpd. Japan sustains leadership in emissions control technologies, and South Korea’s emissions-trading scheme raises modeled IRRs by up to 2.5 percentage points, broadening the waste-to-energy market in Northeast Asia.
Europe ranks second by revenue, characterized by dense district-heat integration and rigorous environmental regulation. Denmark and Sweden already surpass 75% renewable share in municipal heat networks, and the EU Green Taxonomy channels concessional capital into plant retrofits. Germany faces retrofit delays from stricter dioxin caps, while the United Kingdom’s calorific-value rules redirect lower-grade RDF to domestic incinerators, creating new local capacity demand.
North America registers steady expansion anchored by utility-scale projects in the United States and biomethane investments in Canada. Covanta, Waste Management, and FCC Environmental Services vie for large municipal contracts, with recent acquisitions signaling further consolidation. South America sees biogas rollouts in Brazil’s south-central sugar belt, yet feedstock-price volatility tempers project pipelines. In the Middle East and Africa, Egypt’s USD 120 million solid waste-to-electricity plant illustrates rising interest, though overall deployment remains early-stage.

Competitive Landscape
The waste to energy market features a moderately concentrated structure led by Veolia, Suez, Covanta, Waste Management, and China Everbright. Mergers and acquisitions remain brisk: Republic Services earmarked USD 1 billion for 2025 deals after closing multiple 2024 purchases, indicating continued portfolio scaling. Technology differentiation is the primary competitive lever; firms race to commercialize plasma-arc lines, flue-gas scrubbers with catalytic dioxin destruction, and AI-driven feedstock classification systems that boost combustion stability.
GreenUp 24-27 positions Veolia to cut 18 million tons of CO2 by 2027 and treat 10 million tons of hazardous waste, underscoring integration of climate goals with traditional waste services. Asian conglomerates such as Mitsubishi Heavy Industries and Hitachi Zosen Inova secure EPC contracts for plants exceeding 100 MWth, while Nordic utilities pioneer circular power-purchase models for biomethane. Digital twins, IoT sensors, and predictive maintenance platforms collectively lift uptime to 92%–95%, driving cost leadership for early adopters.
White-space opportunities emerge in multi-vector hubs pairing WTE with hydrogen or carbon-capture utilization that supply green feedstocks to chemicals and cement customers. New entrants from renewable-power development and industrial gases sectors seek joint ventures, further intensifying competition. As top players integrate AI capabilities and proprietary emissions-control systems, barriers to entry rise, steering mid-tier firms toward niche regional or feedstock specialties.
Global Waste To Energy (WTE) Industry Leaders
-
Veolia Environnement SA
-
Waste Management Inc.
-
Suez SA
-
Covanta Holding Corp.
-
China Everbright Environment Group
- *Disclaimer: Major Players sorted in no particular order

Need More Details on Market Players and Competitors?
Download PDF
Recent Industry Developments
- March 2025: Veolia North America partnered with Ingenium to launch a high-temperature treatment site in Gum Springs, Arkansas, integrating waste-heat recovery and on-site solar generation to boost energy efficiency.
- March 2025: Sagepoint Energy added two renewable natural gas assets, expanding its capacity to process organic waste into vehicle fuel.
- February 2025: Rå BioPark and Barents NaturGass signed a NOK 1.2 billion (USD 114 million) agreement to distribute 5 million liters of biogas annually from a 60,000-tonne facility in Skibotn, Norway.
- February 2025: Mitsubishi Heavy Industries secured a contract to rebuild the Abukuma Clean Center in Fukushima, Japan, including two 60-tpd stoker incinerators with next-generation flue-gas conditioning.
Global Waste To Energy (WTE) Market Report Scope
Waste-to-energy plants burn municipal solid waste (MSW), sometimes known as rubbish or trash, to generate steam in a boiler, which is then used to power an electric generator turbine. MSW is a composite of energy-dense items such as paper, plastics, yard trash, and wood products.
The waste-to-energy (WtE) market is segmented by technology and geography. By technology, the market is segmented into physical, thermal, and biological. The report also covers the market size and forecasts for the waste-to-energy (WtE) market across major regions. For each segment, the market sizing and forecasts are provided based on revenue (USD).
| By Technology | Physical (Refuse-Derived Fuel, Mechanical Biological Treatment) | ||
| Thermal (Incineration/Combustion, Gasification, Pyrolysis and Plasma-Arc) | |||
| Biological (Anaerobic Digestion, Fermentation) | |||
| By Waste Type | Municipal Solid Waste | ||
| Industrial Waste | |||
| Agricultural & Agro-industrial Residues | |||
| Sewage Sludge | |||
| Others (Commercial, Construction, Hazardous) | |||
| By Energy Output | Electricity | ||
| Heat | |||
| Combined Heat and Power (CHP) | |||
| Transportation Fuels (Bio-SNG, Bio-LNG, Ethanol) | |||
| By End-user | Utilities and Independent Power Producers (IPPs) | ||
| Industrial Captive Plants | |||
| District Heating Operators | |||
| Transport Fuel Distributors | |||
| By Geography | North America | United States | |
| Canada | |||
| Mexico | |||
| Europe | United Kingdom | ||
| Germany | |||
| France | |||
| Spain | |||
| Nordic Countries | |||
| Russia | |||
| Rest of Europe | |||
| Asia-Pacific | China | ||
| India | |||
| Japan | |||
| South Korea | |||
| ASEAN Countries | |||
| Rest of Asia-Pacific | |||
| South America | Brazil | ||
| Argentina | |||
| Colombia | |||
| Rest of South America | |||
| Middle East and Africa | United Arab Emirates | ||
| Saudi Arabia | |||
| South Africa | |||
| Egypt | |||
| Rest of Middle East and Africa | |||
By Technology
| Physical (Refuse-Derived Fuel, Mechanical Biological Treatment) |
| Thermal (Incineration/Combustion, Gasification, Pyrolysis and Plasma-Arc) |
| Biological (Anaerobic Digestion, Fermentation) |
By Waste Type
| Municipal Solid Waste |
| Industrial Waste |
| Agricultural & Agro-industrial Residues |
| Sewage Sludge |
| Others (Commercial, Construction, Hazardous) |
By Energy Output
| Electricity |
| Heat |
| Combined Heat and Power (CHP) |
| Transportation Fuels (Bio-SNG, Bio-LNG, Ethanol) |
By End-user
| Utilities and Independent Power Producers (IPPs) |
| Industrial Captive Plants |
| District Heating Operators |
| Transport Fuel Distributors |
By Geography
| North America | United States |
| Canada | |
| Mexico | |
| Europe | United Kingdom |
| Germany | |
| France | |
| Spain | |
| Nordic Countries | |
| Russia | |
| Rest of Europe | |
| Asia-Pacific | China |
| India | |
| Japan | |
| South Korea | |
| ASEAN Countries | |
| Rest of Asia-Pacific | |
| South America | Brazil |
| Argentina | |
| Colombia | |
| Rest of South America | |
| Middle East and Africa | United Arab Emirates |
| Saudi Arabia | |
| South Africa | |
| Egypt | |
| Rest of Middle East and Africa |
Need A Different Region or Segment?
Customize Now
Key Questions Answered in the Report
What is the current value of the waste to energy market, and how fast is it growing?
The waste to energy market stands at USD 42.68 billion in 2025 and is forecast to rise at an 11.22% CAGR to USD 72.63 billion by 2030.
Which region holds the largest waste to energy market share?
Asia-Pacific leads with 45% of 2024 revenue, supported by rapid plant roll-outs in China, India, Japan, and South Korea.
Which conversion technology dominates, and what emerging technology is growing the fastest?
Incineration maintains 65% of the 2024 waste to energy market share, while plasma-arc systems are projected to grow at a 16% CAGR through 2030.
What feedstock segment supplies most facilities today?
Municipal solid waste accounts for 70% of the waste to energy market size, providing a consistent, urban-sourced feedstock stream.
How are carbon pricing and landfill bans influencing project economics?
Rising carbon-credit prices in South Korea and landfill bans in India’s Tier-2 cities improve internal rates of return and widen feedstock availability, accelerating new project pipelines.
Which end-user segment is expanding most rapidly?
Transport fuel distributors are slated for a 17% CAGR to 2030 as demand for low-carbon bio-SNG, bio-LNG, and ethanol from waste continues to climb.

